VISC 520 Studio ︎︎︎ Project 1 | Schedule | Resources | Drive
 What makes for meaningful work? For design legends Ray and Charles Eames, finding purpose at work entailed satisfying three audiences: the client, yourself, and society.
In a hand-drawn doodle created for a 1969 exhibition at the Musée des Arts Décoratifs in Paris, the Eameses explained that the process behind every project they took on—be it a new chair for Herman Miller, dorm furniture for Sears, a design audit for the Indian government, or an exhibition for IBM. First, they found common ground with the client, and together agreed on solutions that would satisfy business goals and benefit the most number of people. — Anne Quito (from an article HERE)
It is in this area of overlapping interest and concern that the designer can work with
conviction and enthusiasm,” they wrote, pointing to the shaded section of the diagram. The diagram—which the Eameses hung in their studio following the Paris exhibition—also defined the types of clients the sought-after husband-and-wife designers engaged with.
What have you designed?
Why have you done it? What do you like to do?
What went well? What didn't?
What have you learned?
How would you design differently?
What do you want to learn more about?
What do you love about design? What don’t you love?
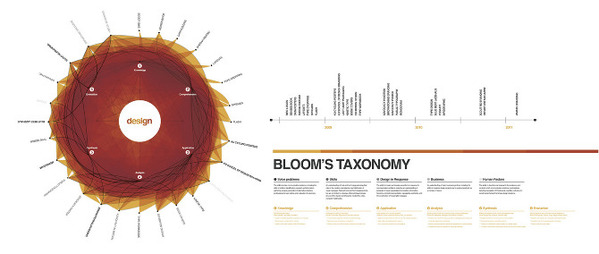
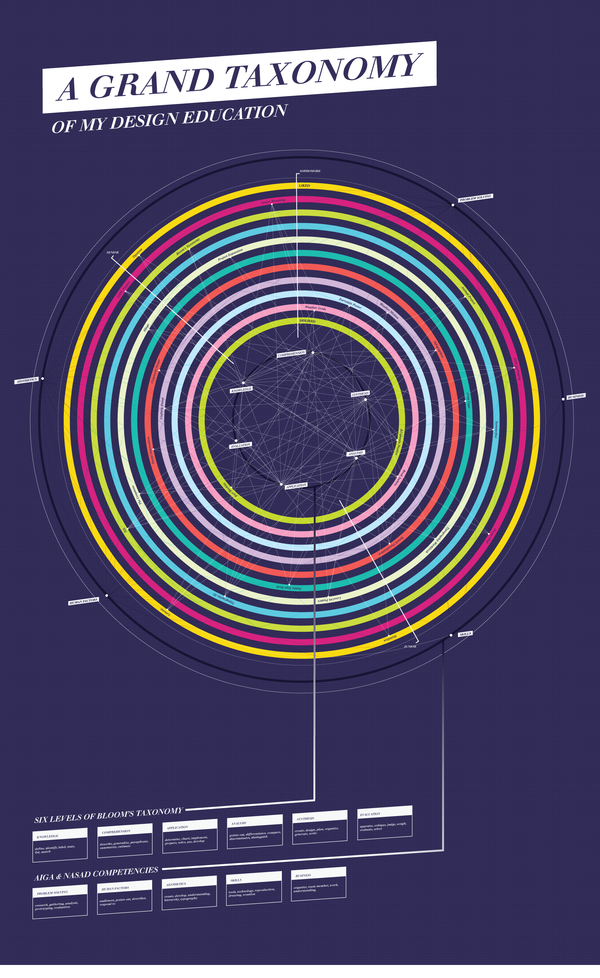
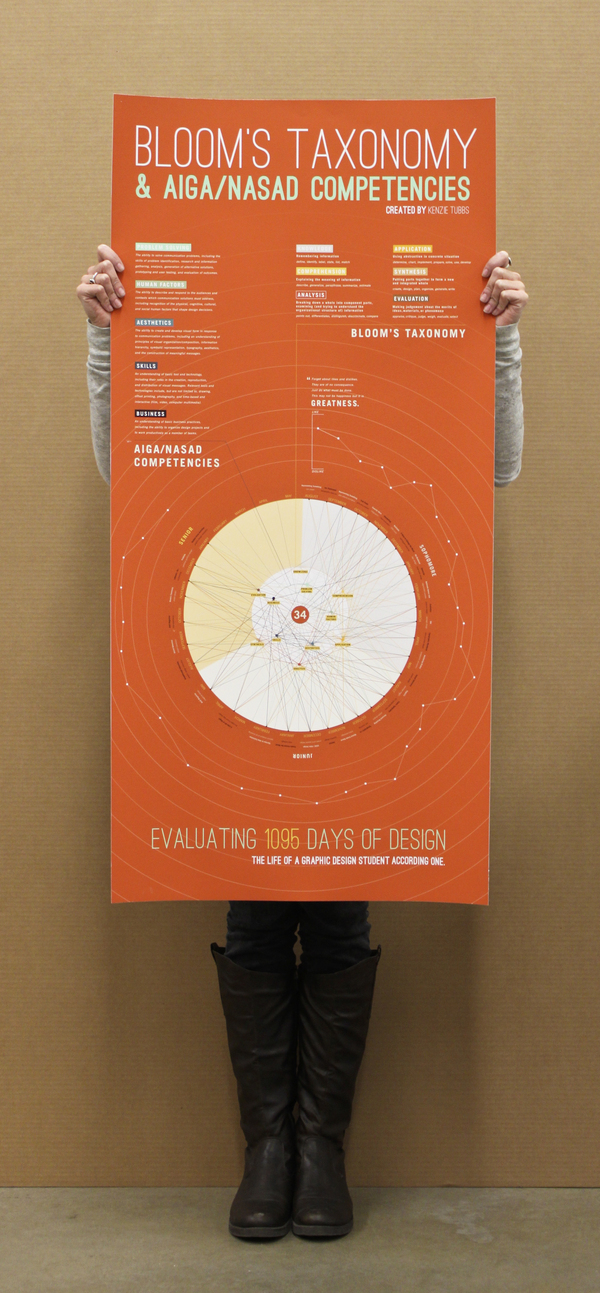
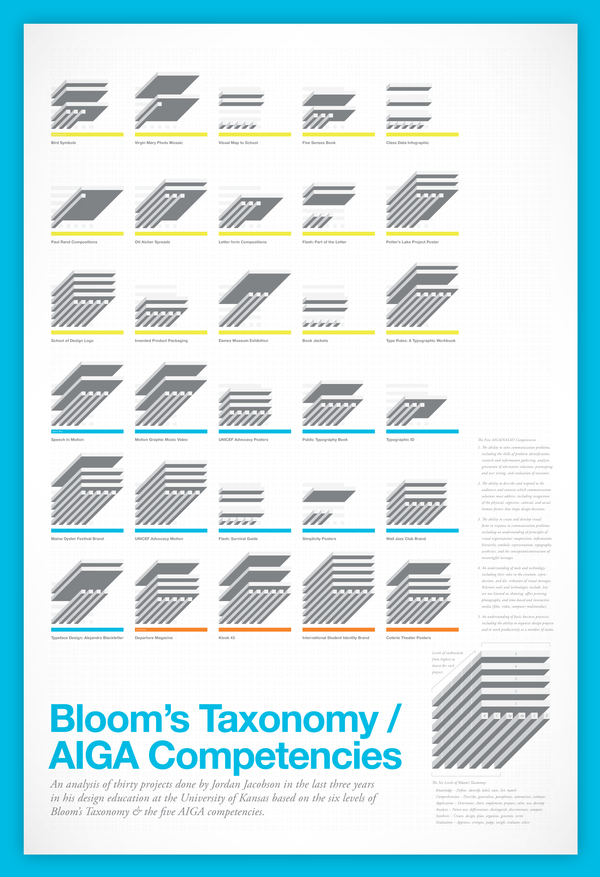
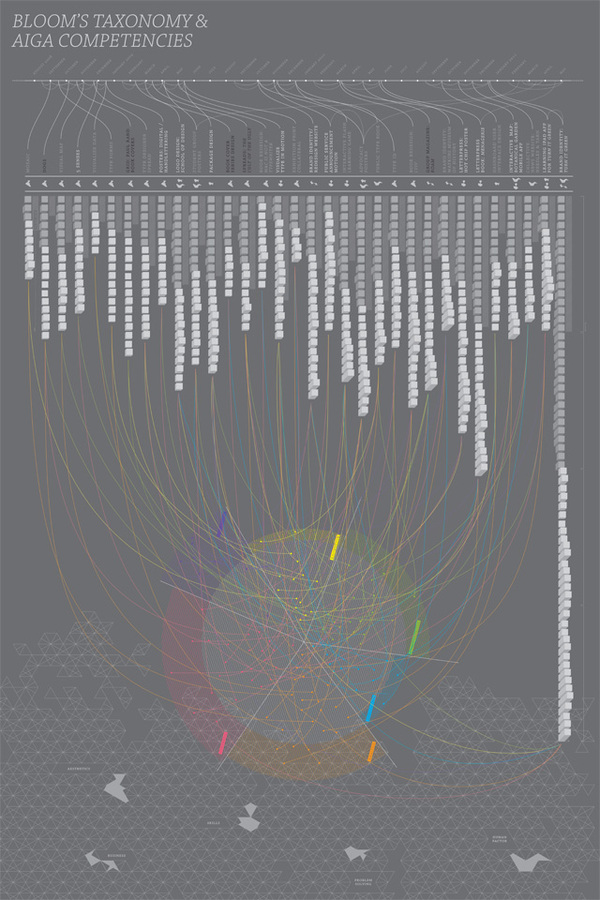
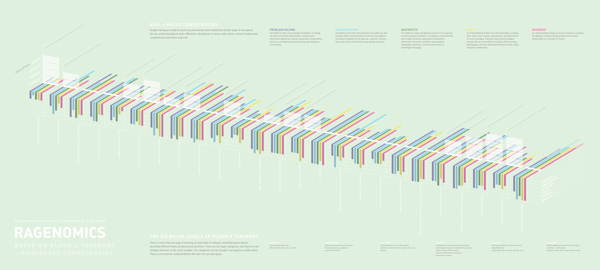
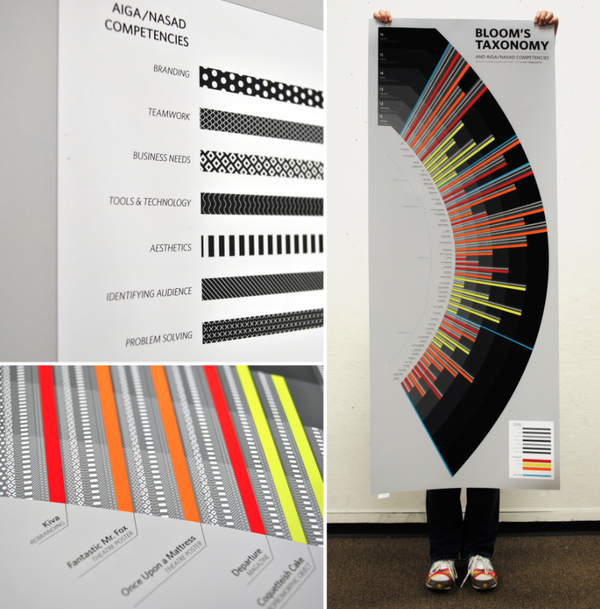
Project One: Your Reflection Diagram/Map
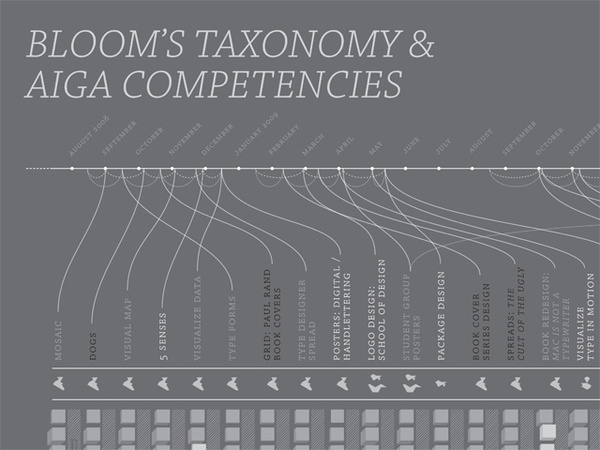
Our profession has been additive (designers have more responsibilities: the thinking and making in all its forms across all our media) and our curriculums have been too to keep up. So this assignment’s objective is to get you to slow down for a sec and reflect on your experiences and communicate your unique story of how your work represents your personal goals and our curricular goals.
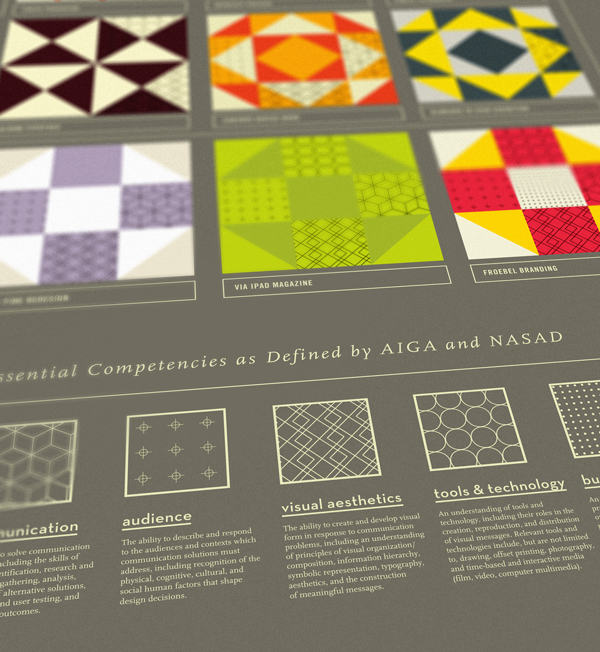
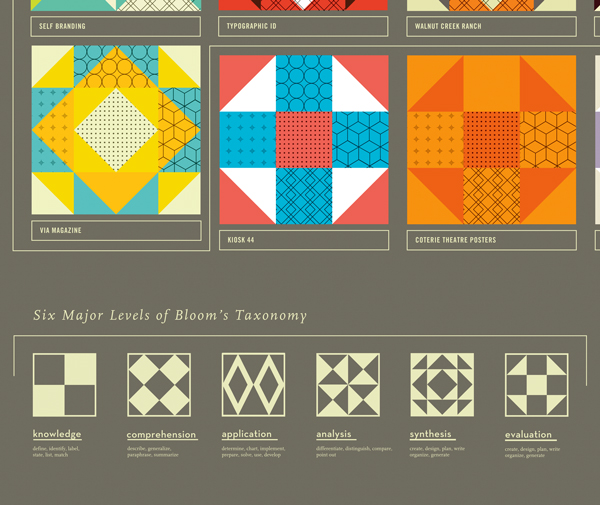
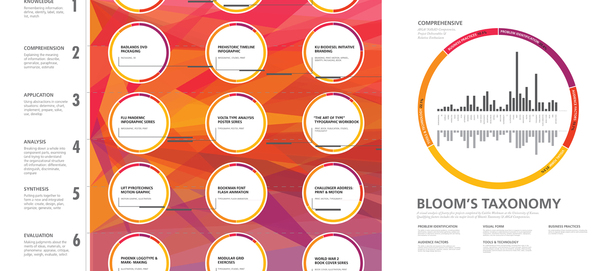
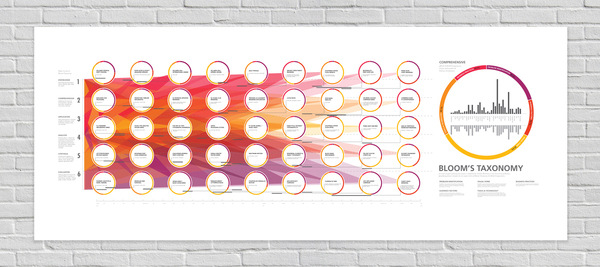
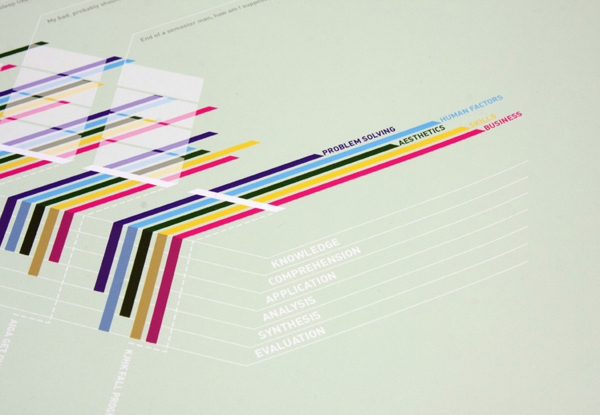
The outcome of this 4-5 week assignment is that you will create a visualization that connects what you learned (taxonomy of learning) what you are supposed to know to prepare you for the profession (competencies) to what you have done. You will find the story that is interwoven between these diverse experiences. You will evaluate what you have learned and what is an interesting way to communicate it.
Steps:
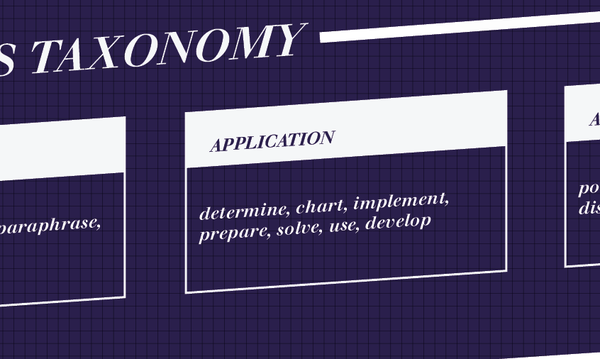
1. Evaluate work based on bloom’s taxonomy 2. Evaluate work based on AIGA/NASAD competencies 3. Evaluate work based on a personal narrative 4. Create map that communicates all these relationships


Inspiration: (google any of these...)
Graph-based diagrams: these take a collection of items and relationships between them, andexpress them by giving each item a 2D position, while the relationships are expressed as connections between the items or overlaps between the items; examples of such techniques:
tree diagram network diagram cluster diagram
flowchart Euler diagram Venn diagram Existential graph
Chart-like diagram techniques: which display a relationship between two variables that take either discrete or a continuous ranges of values:
histogram bar chart pie chart function graph
scatter plot table/matrix exploded view
Tools to make Charts and Graphs: http://rawgraphs.io/
and DATA SETS from fivethirtyeight
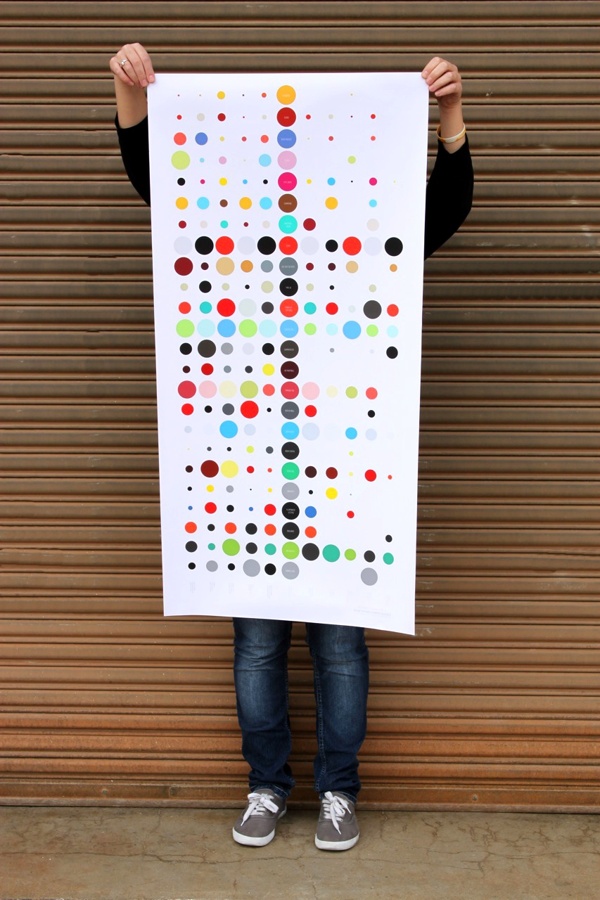
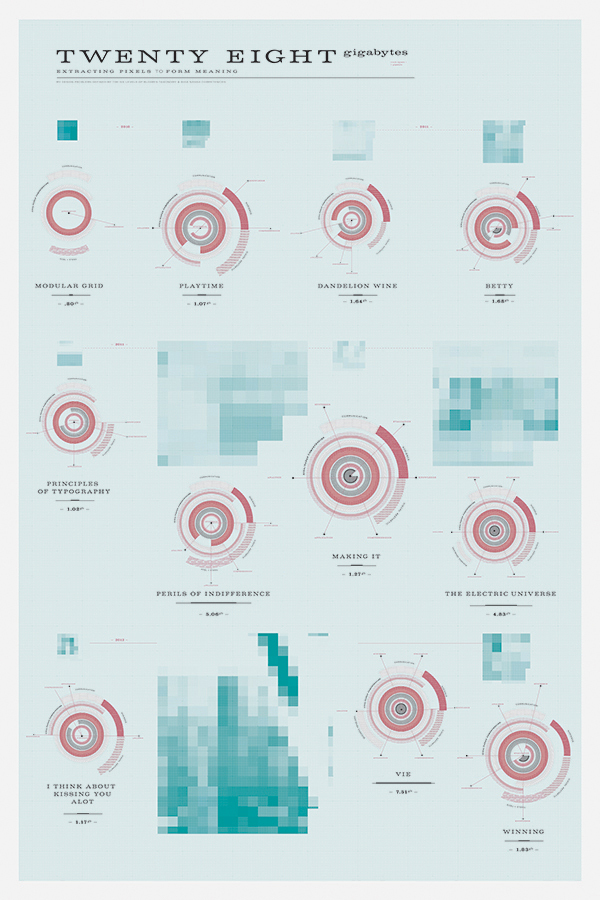
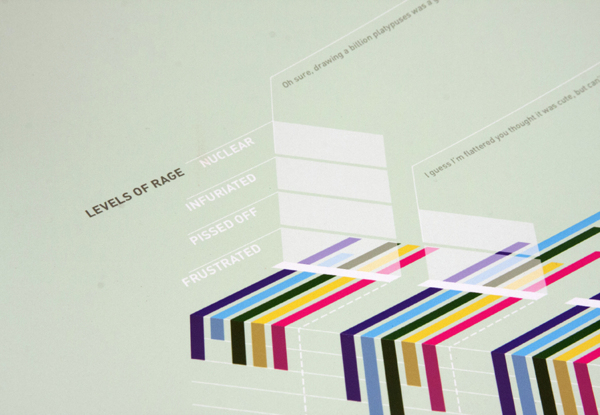
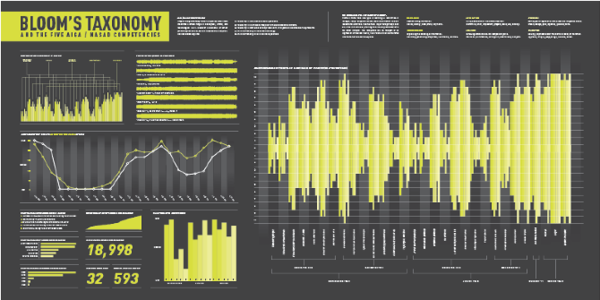
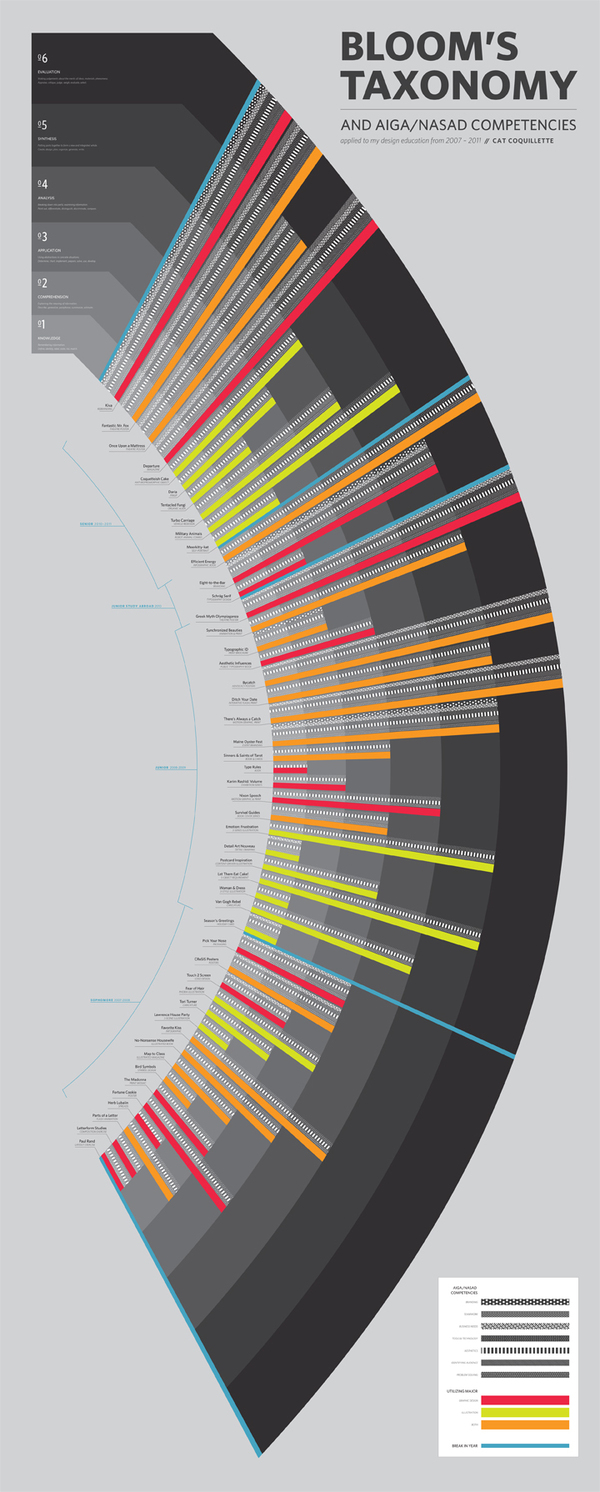
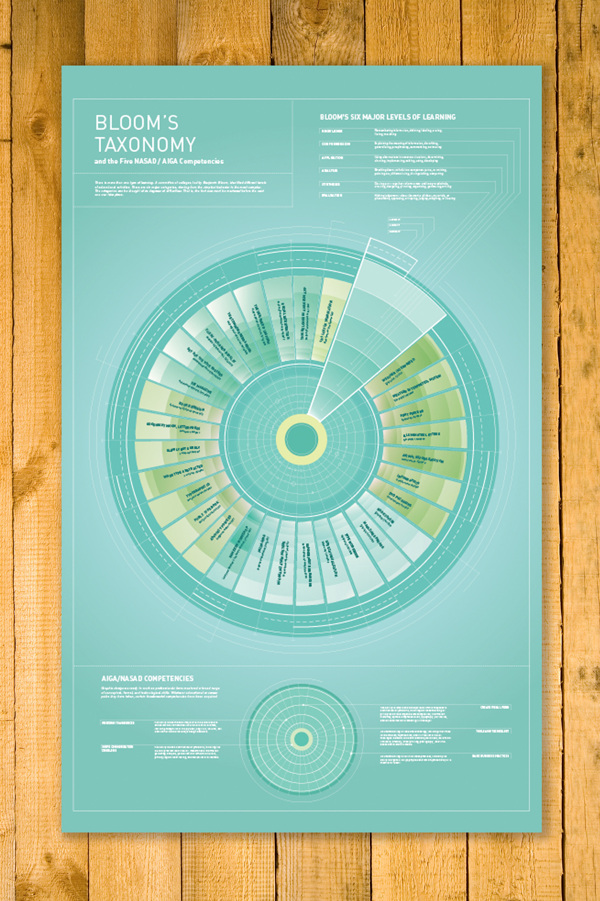
FYI: Designers love maps and diagrams! Sarah Gibbons is a master at explaining them for UX situations and when to use them. Scott Reinhard makes beautiful maps. Nicholas Feltron diagrammed his life!